AI Stocks and Company Guidance Are Telling Different Stories
Company guidance describes the business management expects to run. A share price records what investors are willing to pay for that expectation. The two can diverge for quite a while, and the current AI trade offers a useful example. The AI Market Analyzer at MarketAnalysis.com shows a composite reading of 32 out of 100 for the October 30, 2026 close, placing the trade in its Cooling zone. Its corporate sentiment input, however, stands at 82, inside AI Mania. The same dashboard contains both readings. That is the interesting part.
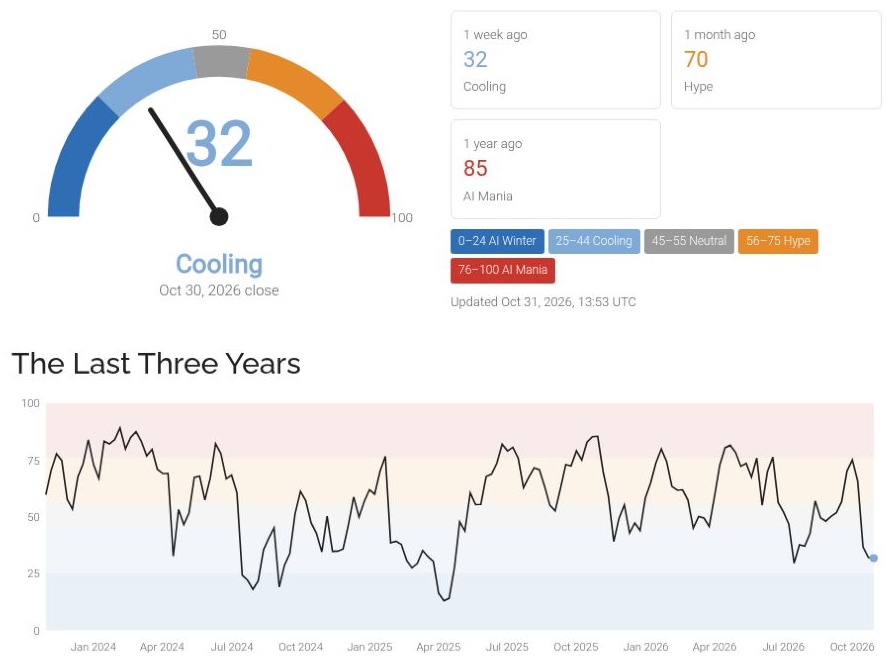
In the screenshot, a black needle points toward the blue side of a semicircular scale, beneath a large blue 32. The gray midpoint and orange and red sections sit farther to the right, visibly removed from the current reading. Three white comparison cards show 32 a week earlier, 70 a month earlier and 85 a year earlier, while a compact color key identifies the five sentiment zones. Below the gauge, a jagged black line runs across pale blue, gray, orange and pink bands covering nearly three years. Its latest descent ends at a blue dot near 32. The visual says something quite specific: the market’s enthusiasm has retreated sharply over the past month, even though the latest weekly comparison shows no further deterioration in the composite.
The strongest evidence of that retreat comes from participation and relative performance. The analyzer reports that only 6 percent of its basket trades above individual 10-week averages. Its momentum measure puts the basket 6.2 percent below its 25-week average, and its four-week return trails the S&P 500 by 12.8 percentage points. Those observations produce component scores of 6 for breadth, 8 for momentum and 1 for relative strength. They describe a trade that is struggling across multiple names, losing its trend and failing to keep pace with the broader market. None of that requires a company to withdraw its revenue guidance.
For readers who follow earnings releases, the corporate sentiment score deserves a closer look. According to the analyzer’s methodology, that input draws on the earnings guidance tracker and daily chip and AI infrastructure digest at k4i.com. It compares next-quarter revenue outlooks with the quarter just reported, gives additional weight to performance against previous guidance and incorporates a smaller contribution from press release tone. This is a different kind of evidence from a moving average. It describes the direction and language of company expectations rather than investors’ response to the price of owning those expectations.
A strong outlook can therefore coexist with a falling share price without either observation being wrong. Investors may already have paid for rapid growth, may require a larger margin for disappointment or may question how much of a supplier’s growth ultimately turns into returns for its customers. These are possible explanations, not causes established by the dashboard. The distinction matters. A sentiment indicator can reveal a disagreement between market behavior and corporate signals; identifying the reason still requires reading the filings, checking the numbers and examining what was expected before the announcement.
Speculation adds another layer. That component scores 87, with SOXL accounting for 69 percent of combined trading in the bullish and bearish leveraged semiconductor ETFs SOXL and SOXS over two weeks. The figure measures activity within that pair, not the opinions of all investors or the proportion of portfolios positioned for an AI rebound. Even with that limitation, it is striking to see strong bullish leveraged activity beside such weak breadth. Some traders are still expressing considerable confidence while the wider basket struggles. That can accompany a successful rebound, but it can also persist during a decline.
The composite should be read with its construction in mind. The analyzer averages seven scores and uses an equal-weight equity basket of 18 companies across the AI supply chain and major platforms. Its market-based components are ranked against their own two-year histories. A score of 32 is consequently a description of the indicator’s current condition, not a 32 percent probability of recovery, a valuation estimate or a forecast for AI revenues. The high corporate sentiment and speculation readings also lift the average above several much weaker components. The headline number alone hides that spread.
The next useful development would be evidence that the two stories are moving closer together. If upbeat guidance is followed by improving breadth, stronger relative returns and a recovery in momentum, the business narrative would gain support from market participation. If those measures remain weak, optimistic announcements will continue to face a skeptical audience. For now, the AI Market Analyzer offers a disciplined reason to read corporate outlooks and stock performance side by side. The current AI market is cooling, while expectations inside parts of the industry remain warm. The original dashboard and methodology make that gap visible; the task is to follow how it changes.
Figures refer to the October 30, 2026 close, as displayed in the dashboard updated October 31, 2026.